Workshop: Comparing Classification Methods
Introduction
Over the past two weeks, we have considered four different classification approaches: K-nearest neighbors (KNN), logistic regression, linear discriminant analysis (LDA), and quadratic discriminant analysis (QDA). In this workshop, we’ll consider the types of scenarios in which one approach might outperform the others.
Conceptual (30 minutes)
We’ll start by comparing and contrasting some theoretical scenarios. We’ll assume for simplicity that each data set contains just two predictors, \(X1\) and \(X_2\).
In each scenario, discuss with your table how you would expect each of the four classification methods (KNN, logistic regression, LDA, and QDA) to perform on the data that’s described.
A few things to consider:
- What assumptions does each method make?
- Does the data described in the scenario break any of those assumptions?
- What does that mean for the bias/variance tradeoff?
- Is there one method that you think would perform best?
Scenario 1
There are 20 training observations in each of the two classes. \(X_1\) and \(X_2\) are uncorrelated random normal variables, with a different mean in each class.
Scenario 2
The details are the same as in Scenario 1, except that within each class \(X_1\) and \(X_2\) have a correlation of -0.5.
Scenario 3
The data were generated from a \(t\) distribution, and we have 50 observations per class. The \(t\) distribution has a similar shape to the normal (gaussian) distribution, but it has a tendency to yield more extreme points – that is, more points that are far from the mean.
Scenario 4
The data were generated from a normal distribution, with a correlation of 0.5 between the predictors in the first class, and correlation of -0.5 between the predictors in the second class.
Scenario 5
Within each class, the observations were generated from a normal distribution with uncorrelated predictors. The responses were sampled from the logistic function using \(X_1^2\), \(X_2^2\), and \(X_1 \times X_2\) as predictors.
Scenario 6
Details are the same as in the Scenario 5, but the responses were sampled from a more complicated non-linear function.
Note: these scenarios are excerpted from Section 4.5.2 of ISLR/ISLP. I strongly recommend that you talk through the scenarios first, and then use the book to check your intuitions.
Applied (30 minutes)
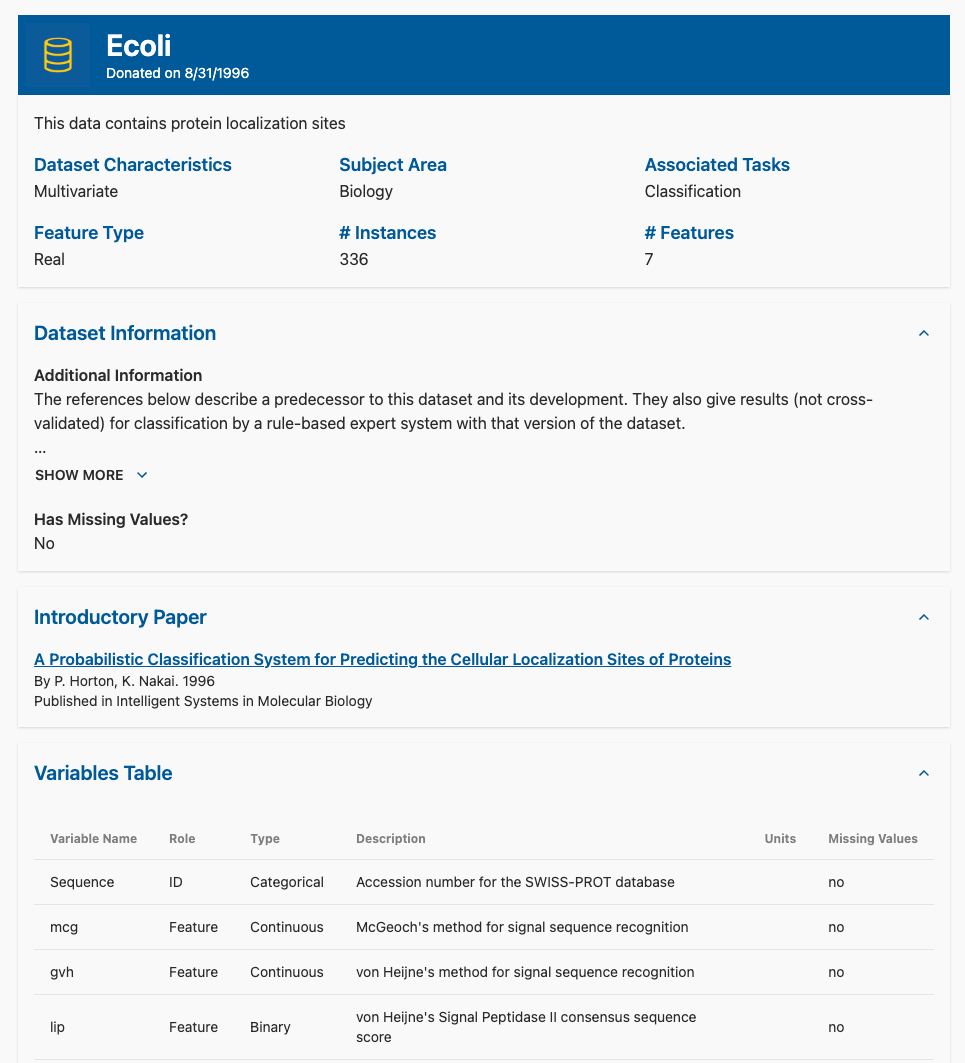
If time permits after you and your team complete the conceptual part of this workshop, let’s leave the realm of the hypothetical and take these methods out for a drive on some real data! There are over 650 datasets available through the UCI Machine Learning Repository, many of them particularly amenable for testing out classification methods.
Each dataset contains a brief summary of some basic metadata (# instances, # attributes, whether they’re numerical or categorical, whether there are missing values, etc.) as well as a text description of each attribute. For example, if we take a look at the E. Coli dataset: